If you think baseball is all about numbers, try the wine industry.
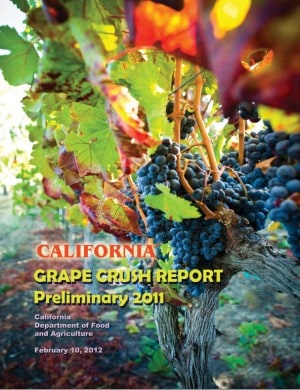
Statisticians, economists and fans of math, it’s time to grab your calculators and Google spreadsheets. As they do at this time every year, the National Agricultural Statistics Service have published the “Grape Crush Report.” The 123-page report covers 17 pricing districts across California – including Sonoma, Napa, Mendocino, Santa Cruz, Monterey, San Luis Obispo – and will likely induce a lot of head spinning with its dizzying array of numbers, graphs, and tables.

For those looking for a Cliff Notes-style condensed version of the key metrics, I will try to oblige with a summary (you can find a useful summary of the report on page 1 of the 54MB pdf located here).
2011 crush totaled 3,869,894 (that’s a lot of purple feet), down about 3% from the previous year. Once again, red wine led the way accounting for about 50% of the output.
With supply down, prices rose; though there could be multiple reasons as to why, including the fact that the overall economy is improving. From the report: “The 2011 average price of all varieties reached a record high of $588.96, up 8 percent from 2010 and 3 percent above the previous record high set in 2009.”
more STARK Napa
Red wine is the most expensive, at $709 per tonne.
Consequently, you could speculate that on average 2011 vintages will be more expensive than previous years.
It would take the better half of my lifetime to pour over the data, and tables. Of course, these numbers will tell you the what, but not necessarily reveal the why.


