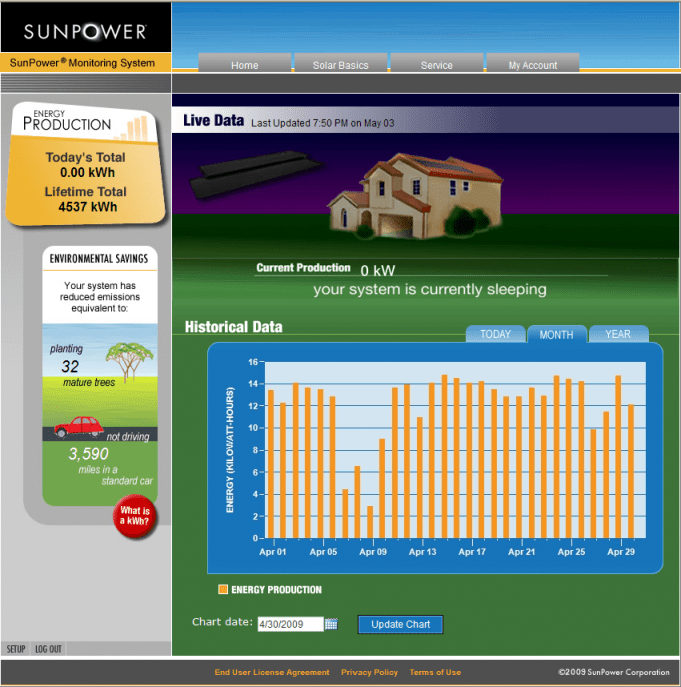
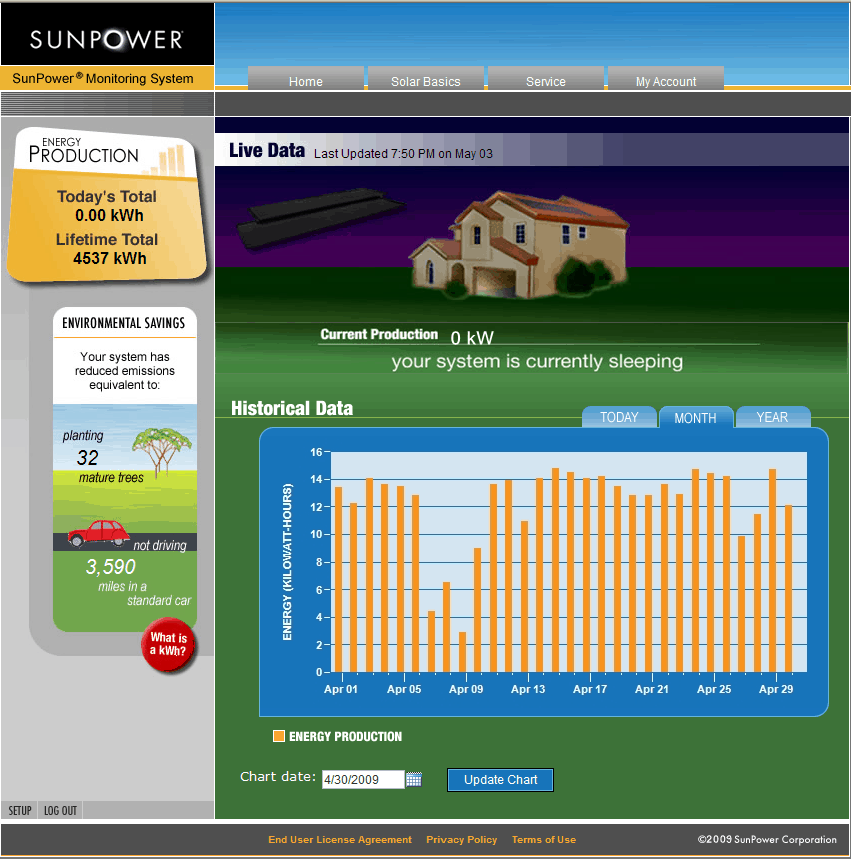
I just realized late this Sunday evening that I have not reported on last month’s Sunpower solar energy generation statistics, a task I normally perform on the last day of the month. Well, to delay it no longer, here is the graph for April. You can see the Spring/Summer season is starting to get into full swing here in the Bay Area with solar energy generation reaching most days the 14 kw/hr levels.
One of the things I want to do is take the entire year we have had the solar panels installed and compare to the previous year to see if we are on track with the payback period. The analysis will not be completely accurate since we did install a wine cellar about the same time the solar panels went up.
Perhaps next month I will provide commentary on this.


